Reading-notes
pandas
mport as follows:
import pandas as pd
series ( is like a col and data frame is like a table)
pd.series() # for col
pd.loc() # for rows
pd.DatafFame() # for table
Pandas use the loc attribute to return one or more specified row(s)
data = {
  "calories": [420, 380, 390],
  "duration": [50, 40, 45]
}

#load data into a DataFrame object:
df = pd.DataFrame(data)

print(df)


     calories  duration
  0       420        50
  1       380        40
  2       390        45


#refer to the row index:
print(df.loc[0])                # returns a Pandas Series.

Result

  calories    420
  duration     50
  Name: 0, dtype: int64
give labels to your series
data = {
  "calories": [420, 380, 390],
  "duration": [50, 40, 45]
}
df = pd.DataFrame(data, index = ["day1", "day2", "day3"])

       calories  duration
  day1       420        50
  day2       380        40
  day3       390        45


  print(df.loc["day2"])
Object creation
1- Creating a Series by passing a list of values, letting pandas create a default integer index
2- Creating a DataFrame by passing a NumPy array, with a datetime index and labeled columns
3- Creating a DataFrame by passing a dict of objects that can be converted to series-like.
Viewing data
Selection
Selecting a single column, which yields a Series, equivalent to df.A
Selecting via [], which slices the rows.
Selection by label
For getting a cross section using a label:
df.loc[dates[0]]
Time series
pandas has simple, powerful, and efficient functionality for performing resampling operations during frequency conversion (e.g., converting secondly data into 5-minutely data)
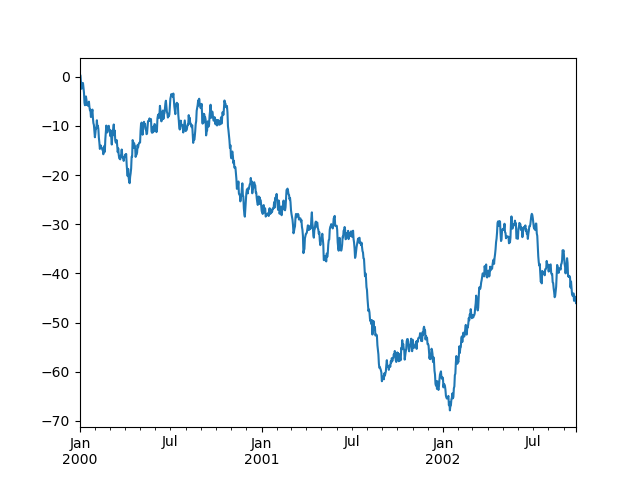
Plotting
We use the standard convention for referencing the matplotlib Applying
Grouping
By “group by” we are referring to a process involving one or more of the following steps:
Splitting the data into groups based on some criteria
Applying a function to each group independently
Combining the results into a data structure
What kind of data does pandas handle?
Import the package, aka import pandas as pd
A table of data is stored as a pandas DataFrame
Each column in a DataFrame is a Series
You can do things by applying a method to a DataFrame or Series

How do I read and write tabular data?
 Getting data in to pandas from many different file formats or data sources is supported by read_* functions.
Exporting data out of pandas is provided by different to_*methods.
The head/tail/info methods and the dtypes attribute are convenient for a first check.
How do I select a subset of a DataFrame?
a- How do I select specific columns from a DataFrame?
To select a single column, use square brackets [] with the column name of the column of interest.
b- How do I filter specific rows from a DataFrame?
To select rows based on a conditional expression, use a condition inside the selection brackets [].
c- How do I select specific rows and columns from a DataFrame? Select specific rows and/or columns using iloc when using the positions in the table
ou can assign new values to a selection based on loc/iloc.
How to create plots in pandas?
The .plot.* methods are applicable on both Series and DataFrames
By default, each of the columns is plotted as a different element (line, boxplot,…)
Any plot created by pandas is a Matplotlib object.

How to create new columns derived from existing columns?
Create a new column by assigning the output to the DataFrame with a new column name in between the [].
Operations are element-wise, no need to loop over rows.
Use rename with a dictionary or function to rename row labels or column names.
How to calculate summary statistics?
Aggregation statistics can be calculated on entire columns or rows
groupby provides the power of the split-apply-combine pattern
value_counts is a convenient shortcut to count the number of entries in each category of a variable
How to reshape the layout of tables?
Sorting by one or more columns is supported by sort_values
The pivot function is purely restructuring of the data, pivot_table supports aggregations
The reverse of pivot (long to wide format) is melt (wide to long format)

How to combine data from multiple tables?
Multiple tables can be concatenated both column-wise and row-wise using the concat function.
For database-like merging/joining of tables, use the merge function.

How to handle time series data with ease?
Valid date strings can be converted to datetime objects using to_datetime function or as part of read functions.
Datetime objects in pandas support calculations, logical operations and convenient date-related properties using the dt accessor.
A DatetimeIndex contains these date-related properties and supports convenient slicing.
Resample is a powerful method to change the frequency of a time series.
How to manipulate textual data?
String methods are available using the str accessor.
String methods work element-wise and can be used for conditional indexing.
The replace method is a convenient method to convert values according to a given dictionary.